Analysis of AUR and Official Arch Repository data
Last updated December 2, 2017
Arch Linux provides packages through the official Arch Linux repositories and the Arch User Repository (AUR). I recently gathered data on ~50,000 packages from these repositories on archlinux.org to better understand the makeup of the packages. In this article I will share some visualizations I made as well as some key takeaways about the data set I gathered.
The repo with all of the data I collected as well as the code I used to do so is available in this repository on my Github account.
Growth of the AUR
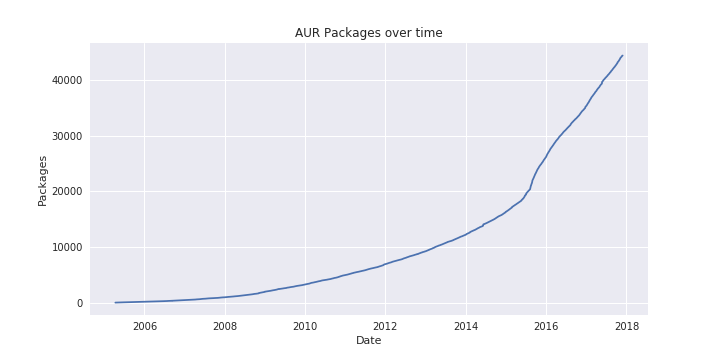
The first questions I had about the dataset were about visualizing the growth of the AUR over time. Each package in the AUR has a First Submitted date, so I was able to put this together easily:
sns.set()
df = df[df['First Submitted'].notnull()]
df["First Submitted"] = pd.to_datetime(df['First Submitted'])
list_of_dates = df["First Submitted"].sort_values()
counts = np.arange(0, len(list_of_dates))
plt.figure(figsize=(10, 5))
_ = plt.plot(list_of_dates, counts)
_ = plt.title('AUR Packages over time')
_ = plt.xlabel('Date')
_ = plt.ylabel('Packages')
It looks like there was a big boost in the number of packages submitted in mid-2015 and that number has been growing consistantly since then.
Official Repositories
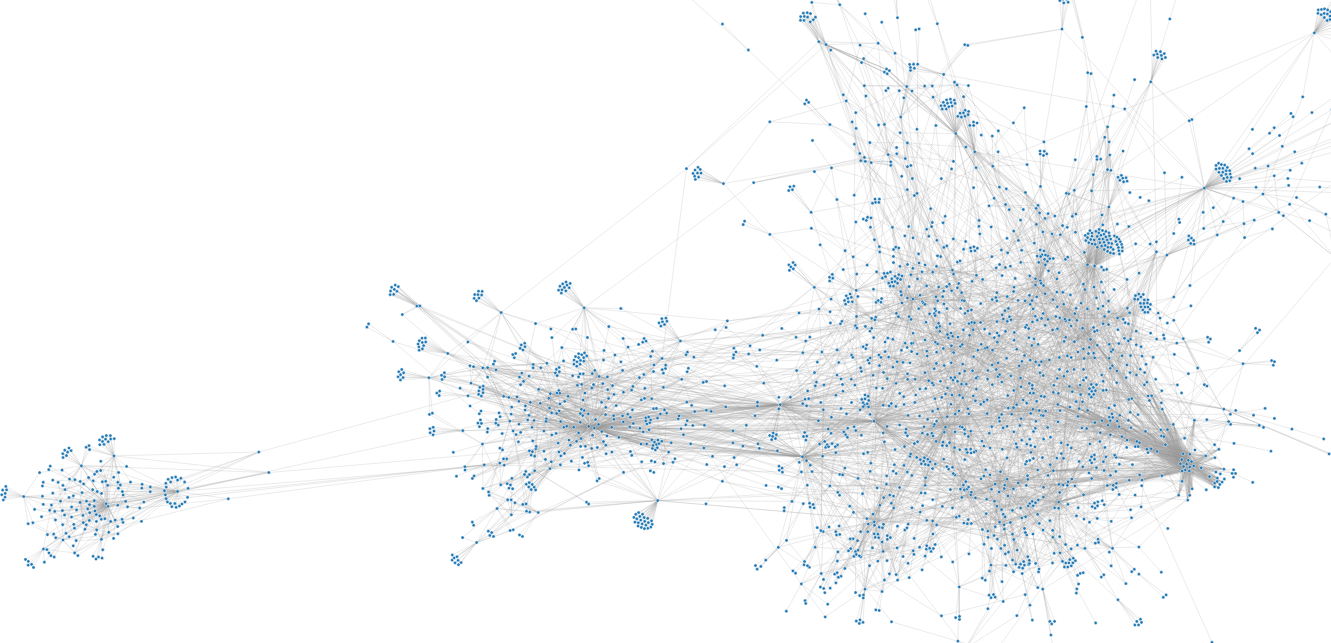
The official repositories contain just under 10,000 packages. Here is a force-directed graph (undirected graph) in D3.js that shows these packages as nodes and package dependencies as edges. This image shows a sample of about 1,000 packages and it is somewhat representative of the whole graph show further below.
There are four main repo in the official repositories:
- core contains packages for:
- booting Arch Linux
- connecting to the Internet
- building packages
- management and repair of supported file systems
- the system setup process (e.g. openssh)
-
extra contains all packages that do not fit in core. Example: Xorg, window managers, web browsers, media players, tools for working with languages such as Python and Ruby, and a lot more.
-
community contains packages that have been adopted by Trusted Users from the Arch User Repository. Some of these packages may eventually make the transition to the core or extra repositories as the developers consider them crucial to the distribution.
-
multilib contains 32 bit software and libraries that can be used to run and build 32 bit applications on 64 bit installs (e.g. wine, steam, etc).
Here is an SVG showing all packages in the official repository. Click on the image to explore the SVG in more detail, and you can hover over nodes to see which packages they represent.

Turn off the lights and you can see a ring of packages orbiting in a circle!
If you look at this file in detail you can find some interesting clusters of packages. The "island" in the top left includes mostly Haskell packages and pandoc. python, python2, and git are three of the main central hubs in the middle cluster. perl and other related packages make of most of the bottom right cluster and you can see "flowers" of package dependencies mostly for internationalization for popular programs like firefox and thunderbird.
To make this interactive graph and SVG images I did the following:
- Create a dictionary from my data base with packages keys and a list of dependencies as values:
graph_dict = {}
for _, i in df.iterrows():
    graph_dict[i["package_name"]] = i["pkgdeps"]
- Create a NetworkX graph with the dictionary created in the previous step:
G = nx.Graph(graph_dict)
- Export the NetworkX graph to JSON using a built-in NetworkX function:
from networkx.readwrite import json_graph
data = json_graph.node_link_data(G)
- Add a group number to each node element cooresponding to the repository it belongs to.
for n in data['nodes']:
    n['group'] = int(df.loc[(df.package_name == n["id"]), "repo_number"].iloc[0])
- Save the JSON to a file:
with open('/home/brian/Documents/github/briancaffey.github.io/aur/data.json', 'w') as outfile:
    json.dump(data, outfile)
-
Feed the JSON file into this template which renders a D3.js force-directed graph.
-
To save the graph as a SVG file, I ran the NYT crowbar script in the browser console:
var e = document.createElement('script')
e.setAttribute('src', 'https://nytimes.github.io/svg-crowbar/svg-crowbar.js')
e.setAttribute('class', 'svg-crowbar')
document.body.appendChild(e)
Let's take one more look at how tightly
Official Repository Package Sizes
Official Packages include both a Package Size and Installed Size. Here is a Bokeh plot showing Package Size vs. Installed Size:
Warning: Don't hover directly over the cluster of plotted points near the origin of the graph. DOING SO WILL CRASH YOUR BROWSER. This is because the hover tool will attempt to display all packages that you are hovered over and it may be far too many for the browser to handle. Carefully zoom in using the scroll tool and you can find some interesting trends in the types of packages and how much they are able to be compressed.
{% include package_sizes.html %}
Here's the setup for this bokeh graph:
from bokeh.plotting import figure, output_file, show, ColumnDataSource
from bokeh.models import HoverTool
from bokeh.io import output_notebook
output_notebook()

output_file("/home/brian/Documents/github/briancaffey.github.io/_includes/package_sizes.html")

source = ColumnDataSource(
        data=dict(
            x=df.package_size,
            y=df.installed_size,
            desc=df.Description,
            name=df.package_name
        )
    )

hover = HoverTool(
        tooltips=[
            ("Name", "@name"),
            ("Package Size", "@x MB"),
            ("Installed Size", "@y MB"),
            ("Description", "@desc"),
        ]
    )

TOOLS = 'box_zoom,box_select,reset,pan,wheel_zoom'

p = figure(plot_width=400, plot_height=400, tools=[TOOLS, hover],
           title="Packages Size vs. Installed Size", sizing_mode='scale_width')

p.circle('x', 'y', size=5, source=source, alpha=0.2)
p.toolbar.logo = None
show(p)
AUR Word Cloud
Let's make a word cloud out of text descriptions for packages in the AUR.

We can use a popular python package for making word clouds. Here's the code:
import numpy as np
from PIL import Image
from os import path
import matplotlib.pyplot as plt
import random

from wordcloud import WordCloud, STOPWORDS

def grey_color_func(word, font_size, position, orientation, random_state=None,
                    **kwargs):
    return "hsl(0, 0%%, %d%%)" % random.randint(60, 100)

mask = np.array(Image.open("/home/brian/Documents/aur/images/arch_logo.png"))

text = open("/home/brian/Documents/aur/ipynb/package_descriptions.txt").read()

wc = WordCloud(max_words=1000, mask=mask, stopwords=stopwords, margin=10,
               random_state=1).generate(text)

default_colors = wc.to_array()
plt.figure(figsize=(20, 20))
plt.imshow(wc.recolor(color_func=grey_color_func, random_state=3),
           interpolation="bilinear")
wc.to_file("arch_word_cloud.png")
plt.axis("off")
plt.show()
Arch Wiki Members
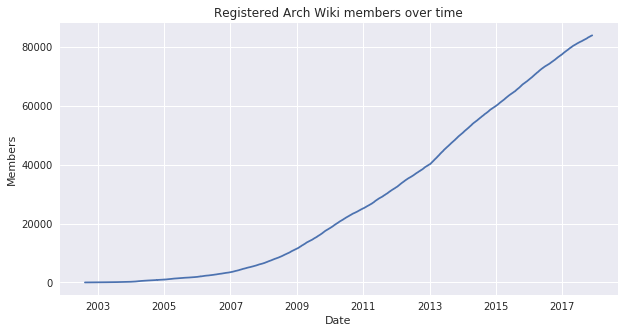
The Arch wiki is the first place I go for troubleshooting any issue with Arch. Users of other Linux distributions have also said how useful it can be even if you don't user Arch Linux. Here's a look at the number of registered users on the Arch Wiki over time:
sns.set()
df = df[df['registered'].notnull()]
df["registered"] = pd.to_datetime(df['registered'])
list_of_dates = df["registered"].sort_values()
counts = np.arange(0, len(list_of_dates))
plt.figure(figsize=(10, 5))
_ = plt.plot(list_of_dates, counts)
_ = plt.title('Registered Arch Wiki members over time')
_ = plt.xlabel('Date')
_ = plt.ylabel('Members')
plt.show()
plt.savefig('/home/brian/Documents/github/briancaffey.github.io/aur/wiki_users.png')
There is a massive amount of data in the Wiki that I haven't obtained for this article. You can also find some interesting statistics on the Arch Wiki site here.