Claude Code dashboards
Claude Code ships OpenTelemetry metrics (claude_code.session.count, claude_code.token.usage, claude_code.cost.usage, …) and teams that run it have Grafana dashboards built on those names. Hermes measures four of the same things under hermes.* names. The metric_name_compat switch exports those four under Claude Code's names, units and labels, so an existing Claude Code dashboard shows Hermes as one more agent, next to Claude Code itself when both report to the same collector. This page walks through it with the LGTM stack and the dashboard it ships.
1. The switch
# hermes_otel.yaml
metric_name_compat: claude_code        # or: both
metric_name_compat_session_id: true    # optional: Claude Code's per-session panels need it

backends:
  - type: lgtm
    endpoint: http://localhost:4318/v1/traces
| Value | What is exported for the four overlapping instruments |
|---|---|
off (default) | hermes.session.count, hermes.token.usage, hermes.cost.usage, hermes.active_time.total |
claude_code | claude_code.session.count, claude_code.token.usage, claude_code.cost.usage, claude_code.active_time.total instead: no duplicate series, and the Claude Code dashboards work |
both | both families: two series per point for these four, when you also keep a hermes.* dashboard |
Everything else (hermes.message.count, hermes.prompt_cache.*, gen_ai.*, the kanban and approval counters, …) is untouched in every mode, and the plugin's own dashboard keeps reading the hermes.* names from its live store, so nothing in it changes. The environment variable is HERMES_OTEL_METRIC_NAME_COMPAT. The full name-by-name table, with the two semantic translations (Claude Code's input is the uncached prompt; the reasoning subset is not a type), is in the metrics reference.
2. The dashboard
docker compose -f docker-compose/lgtm/docker-compose.yaml up -d brings up Grafana with a provisioned folder hermes-otel holding Claude Code Metrics (Prometheus): grafana.com dashboard 25255 (MIT, Rock Martel-Langlois), unchanged except that its datasource input is bound to the stack's Prometheus. It is the one community dashboard that queries all eight Claude Code metrics, including active_time and the newer query_source label, and it is on grafana.com, so it is also what a team with their own Grafana would import (ID 25255).
Open http://localhost:3000 (admin / admin) → Dashboards → hermes-otel → Claude Code Metrics (Prometheus). Run a few Hermes turns with the switch on and the panels fill:
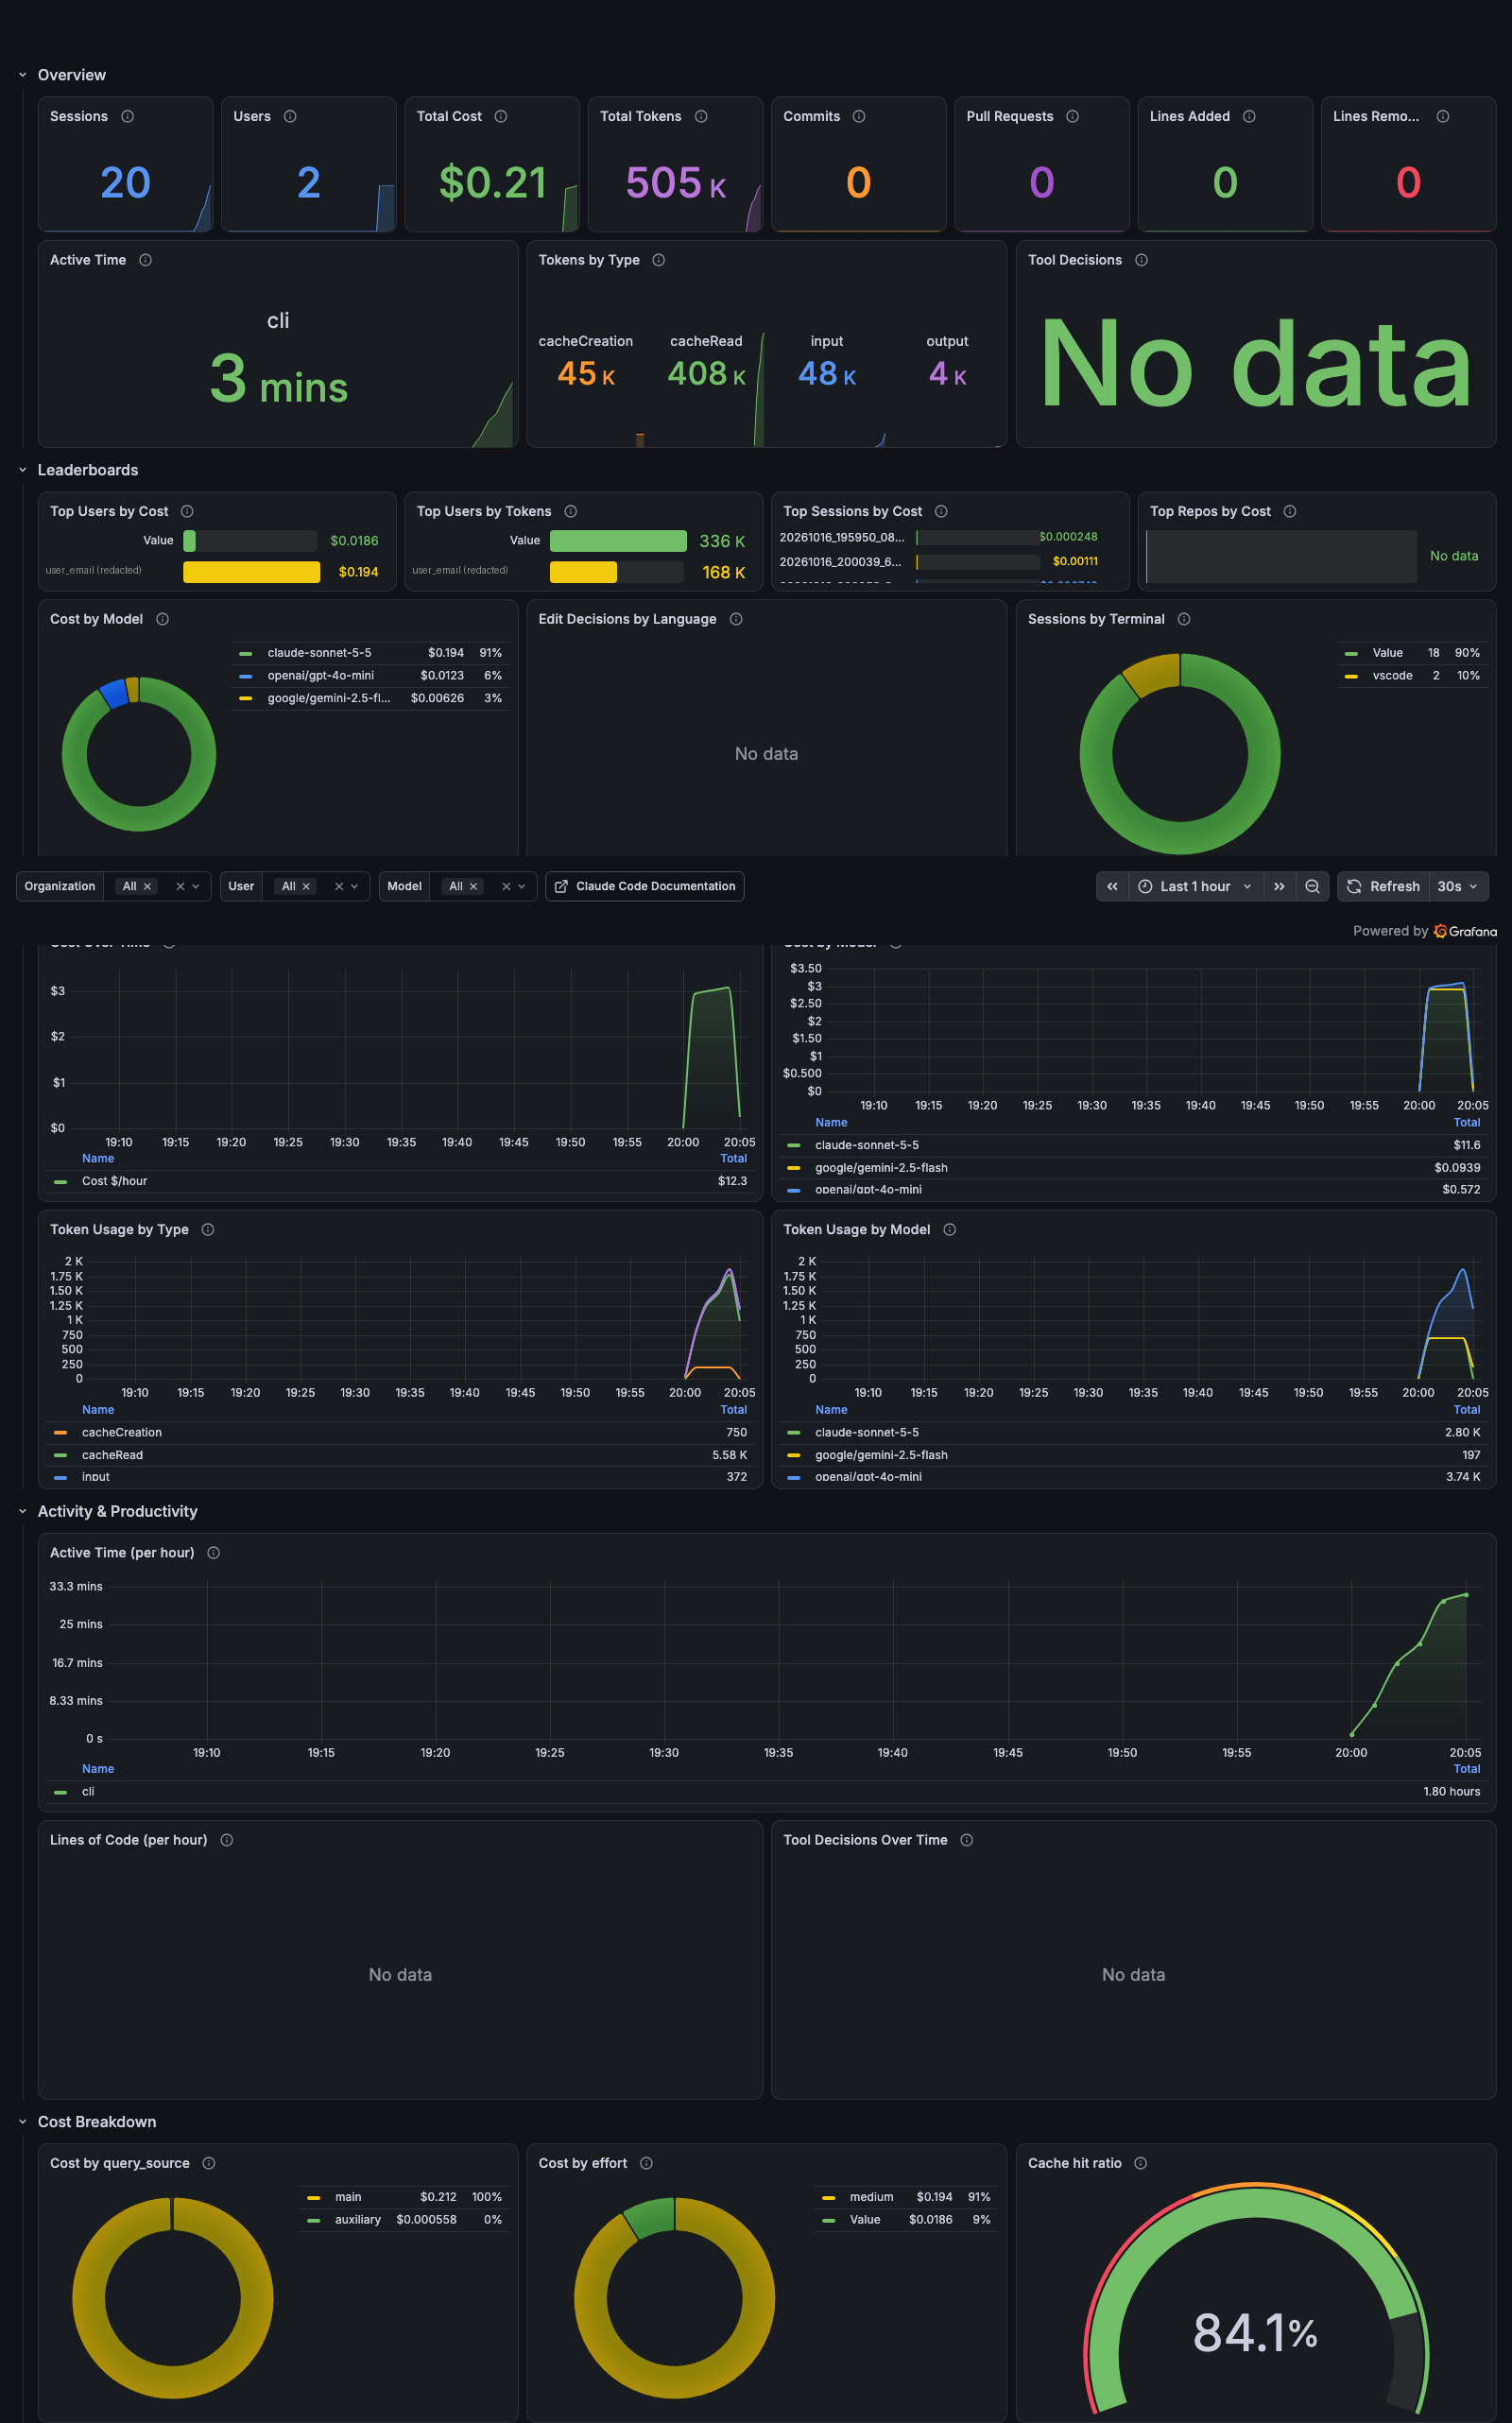
What each panel shows for Hermes:
| Panel | Hermes | Why |
|---|---|---|
| Sessions, Top Sessions by Cost, Sessions by Terminal | one session per Hermes session with metric_name_compat_session_id: true; otherwise one row for all of Hermes | Claude Code puts session.id on every metric by default; the plugin never puts an id on a metric unless you opt in here |
| Total Cost, Cost Over Time, Cost by Model, Cost by query_source | Hermes's own price for every call (agent.usage_pricing), by model and by main / subagent / auxiliary | the same label name and values in both tools |
| Total Tokens, Tokens by Type, Token Usage by Type / Model, Cache hit ratio | input (uncached) + output + cacheRead + cacheCreation; the cache ratio is cacheRead / (cacheRead + cacheCreation + input) exactly as for Claude Code | the twin derives Claude Code's input from Hermes's whole-prompt count |
| Active Time | cli only: the turn's wall-clock | Hermes has no keyboard-time signal for user |
| Users, Top Users, Cost by effort | empty or one unlabelled row | user.email, user.id, organization.id and effort are Claude Code account attributes Hermes does not have |
| Commits, Pull Requests, Lines Added / Removed, Tool Decisions, Edit Decisions by Language | empty | pull_request.count, lines_of_code.count and code_edit_tool.decision have no Hermes counterpart. Hermes does count commits, as hermes.commit.count (#478), but metric_name_compat does not rename it to claude_code.commit.count, so the Commits panel stays empty |
The dashboard's organization and user template variables are built from labels Hermes does not send; leave them on All (the .* match includes series without the label).
increase()Every Claude Code dashboard reads its counters with increase() or rate(), which needs two samples of a series. A Claude Code session lives for minutes and exports every 60 s, so it always has them. A one-shot Hermes run (hermes -z, hermes chat -q) exports each series exactly once and exits, and a single sample has no increase: the panels read 0 while Sessions (a max_over_time) still counts the run. The LGTM stack therefore starts Prometheus with --enable-feature=created-timestamp-zero-ingestion, which writes a 0 sample at the OTLP start timestamp of every cumulative series; a one-shot run then has its two samples and every panel counts it. On another Prometheus (2.50+), enable the same flag; for Mimir, VictoriaMetrics or a hosted store check its documentation for created-timestamp (zero-sample) ingestion; or run Hermes as a long-lived process (the gateway, an interactive hermes chat), where the periodic export (flush_interval_ms, 60 s) gives the dashboards what they expect. increase() extrapolates between its two samples, so a one-shot turn's token count can read a little above the exact figure the raw sample carries.
2b. A dashboard built for the comparison
The community dashboard is the compatibility proof: it is what teams already have, and Hermes shows up on it unchanged. It was not designed for two agents, though: a third of its tiles are Claude Code-only signals (commits, lines of code, users, terminals), it cannot split by agent, and its rate panels extrapolate a handful of 15-second turns into a per-hour figure. So the LGTM stack ships a second dashboard next to it, Agents: Hermes and Claude Code, written by this repo for the two-agent view and generated from scripts/grafana/agents_dashboard.py:
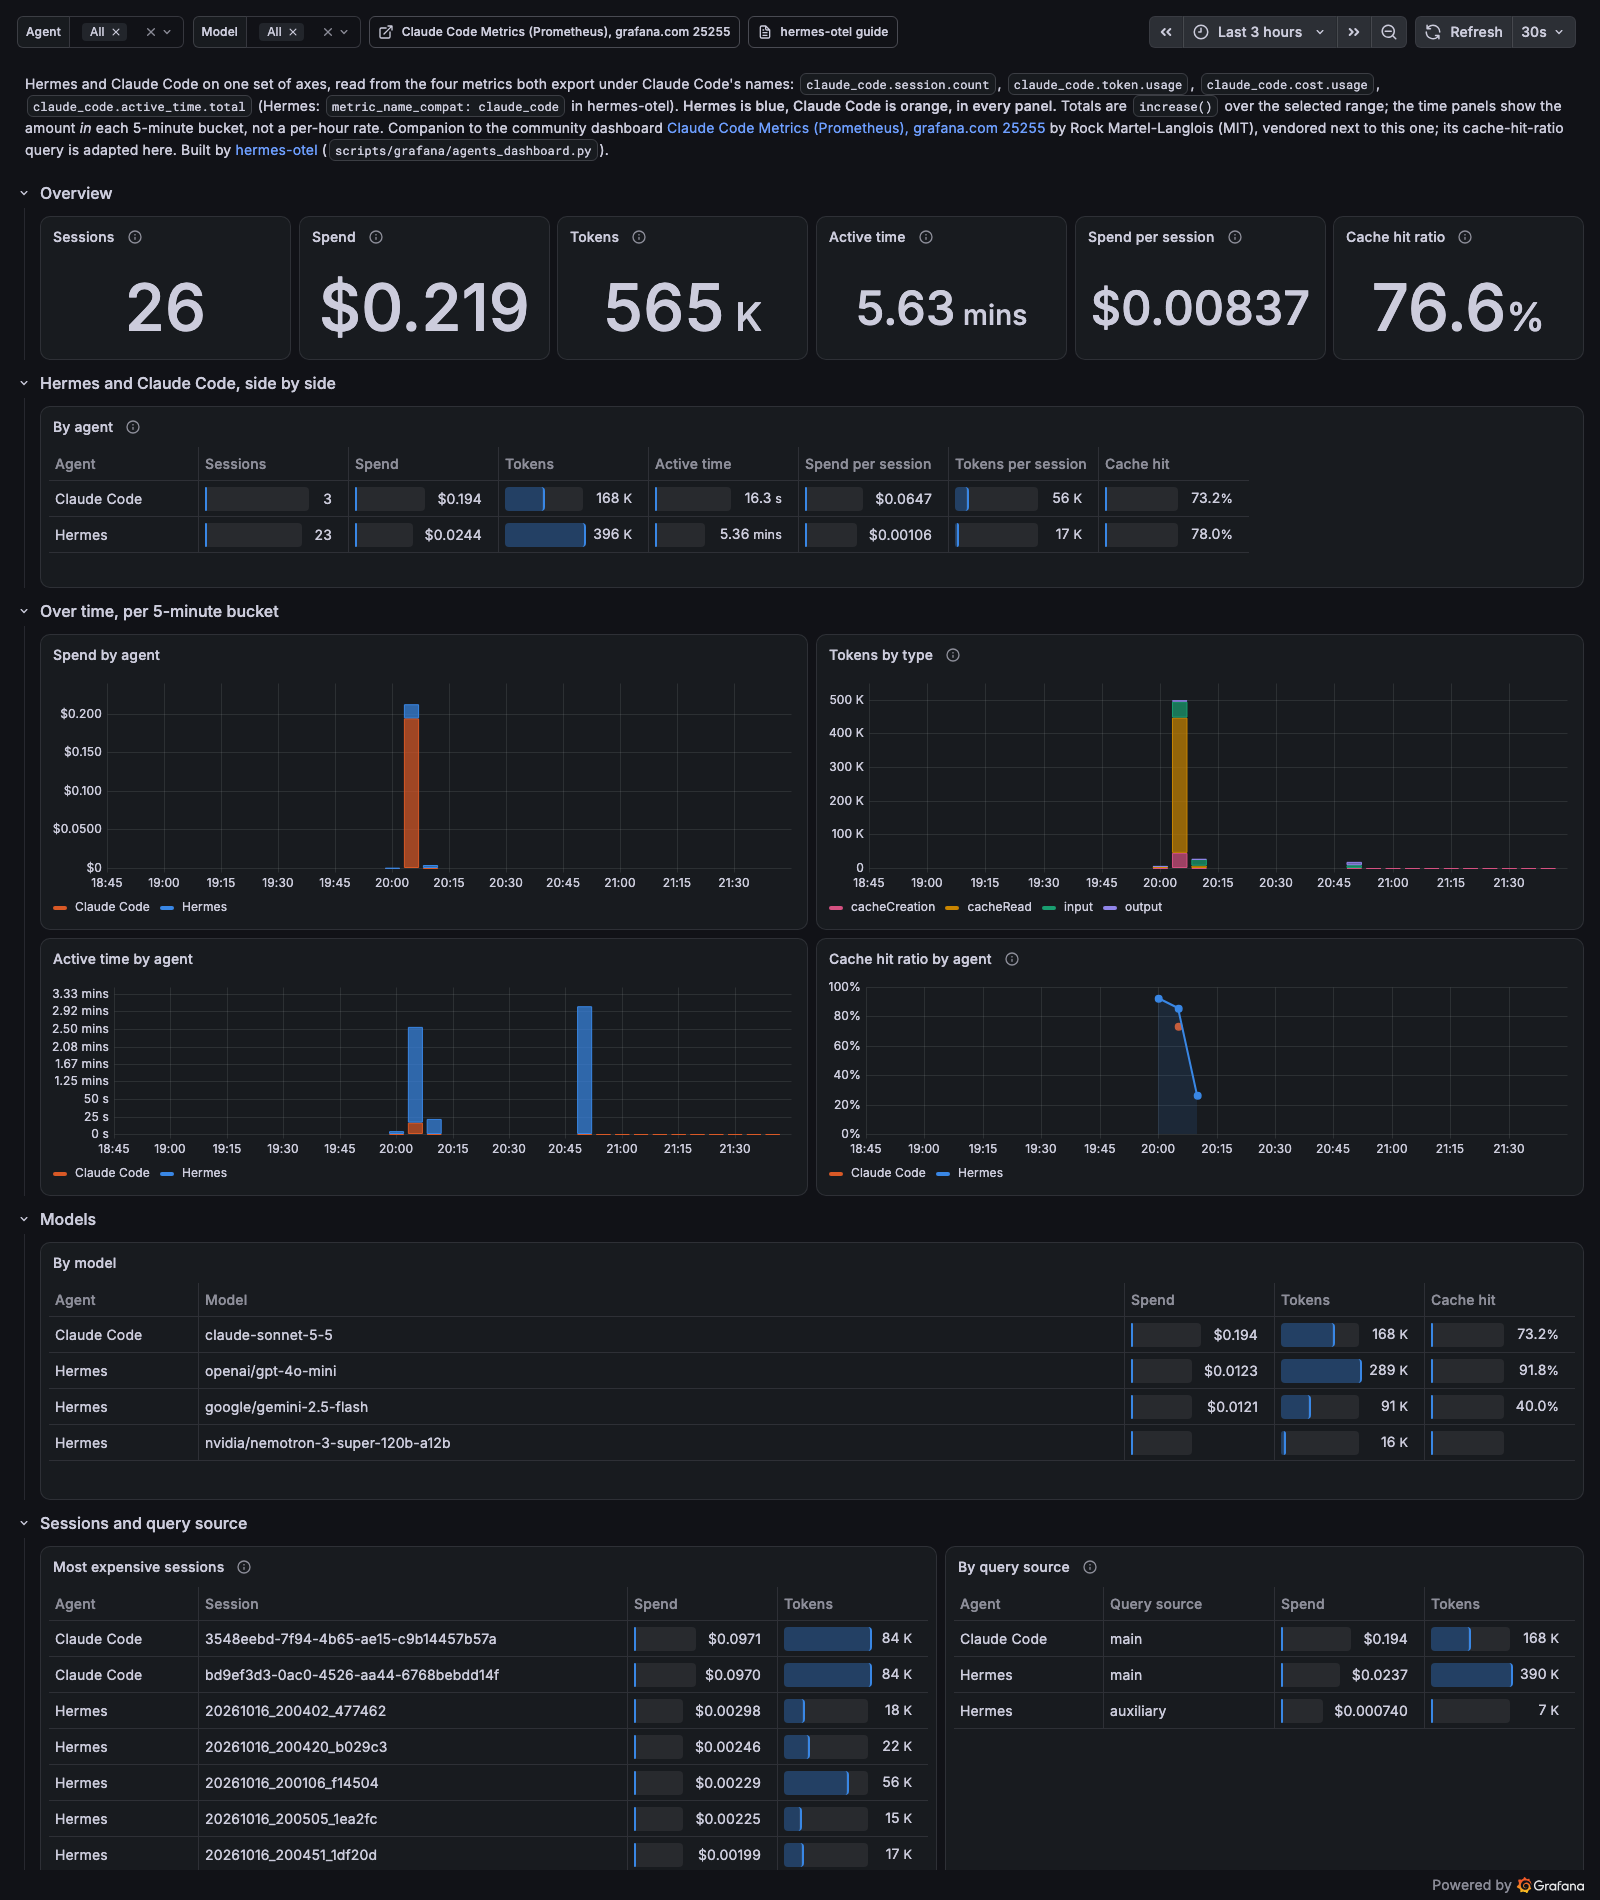
It reads only the four shared metrics plus the service_name label the LGTM Prometheus promotes from the resource, and follows a few rules throughout: Hermes is always blue and Claude Code always orange, whatever the filter leaves on screen; headline numbers are stat tiles, comparisons are tables with a single-hue inline bar per column (identity is the row label, never the colour), and the time panels show the amount in each 5-minute bucket rather than a rate; there is no pie, no second y-axis and no panel Hermes cannot fill. The Agent and Model variables scope every panel. It credits the community dashboard it sits beside, grafana.com 25255 by Rock Martel-Langlois (MIT), whose cache-hit-ratio query it adapts.
3. Claude Code on the same Grafana
Claude Code reports to any OTLP endpoint; point it at the LGTM collector and both agents share the panels (Claude Code's series carry service_name="claude-code", Hermes's service_name="hermes-agent"):
CLAUDE_CODE_ENABLE_TELEMETRY=1 \
OTEL_METRICS_EXPORTER=otlp OTEL_LOGS_EXPORTER=otlp \
OTEL_EXPORTER_OTLP_PROTOCOL=http/protobuf \
OTEL_EXPORTER_OTLP_ENDPOINT=http://localhost:4318 \
OTEL_METRIC_EXPORT_INTERVAL=10000 \
claude
or the same keys under "env" in Claude Code's user-level settings file (Claude Code ignores exporter variables placed in a project's settings). The LGTM collector accepts gRPC on 4317 as well, which is what Claude Code's documentation uses by default. Claude Code's counters are cumulative, so no temporality setting is needed on either side.
This is also the quickest way to check the compatibility yourself: with both tools reporting, Explore → Prometheus → sum by (service_name, type) (claude_code_token_usage_tokens_total) lists Hermes and Claude Code in the same table with the same type values.
4. Other Claude Code dashboards
The compat instruments are the names and labels, not one dashboard. Anything built on Claude Code's metric contract reads them: Anthropic's monitoring guide (sum by (type)(increase(claude_code_token_usage_tokens_total[$__range]))), the ColeMurray/claude-code-otel dashboard (which pins job="otel-collector": drop that matcher or set service.name to match), the Grafana Cloud Claude Code integration, and Datadog or Honeycomb boards on the dotted names. Dashboards that also read Claude Code's events (claude_code.api_request, claude_code.tool_result, …) from Loki are a different contract: Hermes's structured log events are hermes.* and are not renamed.
Names your backend shows
| OTel | Prometheus / LGTM / Mimir |
|---|---|
claude_code.session.count | claude_code_session_count_total |
claude_code.token.usage (tokens) | claude_code_token_usage_tokens_total |
claude_code.cost.usage (USD) | claude_code_cost_usage_USD_total |
claude_code.active_time.total (s) | claude_code_active_time_seconds_total |
The unit is appended to the name and an existing total token is folded into the _total suffix; that is the OpenTelemetry→Prometheus translation both the Collector's Prometheus exporter and Prometheus's native OTLP receiver apply, and it is what Claude Code's own dashboards query.